
Dashboard Templates
Audience
CEOs, CFOs, executives, and senior managers who need a clear, high-level view of company performance.
Key Performance Metrics
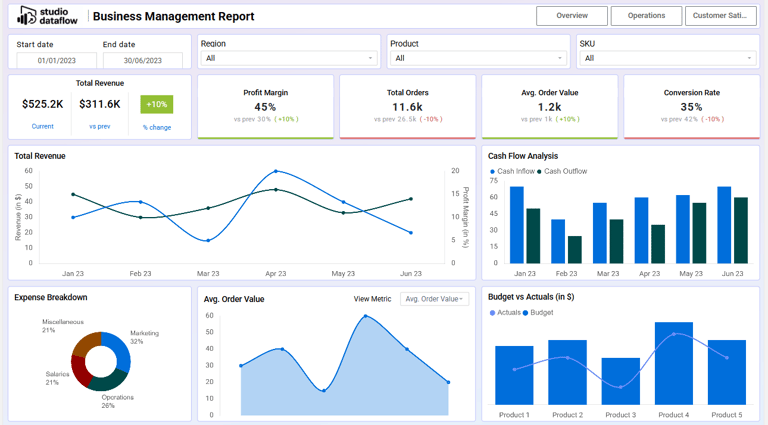
Revenue, profit, and expense trends
Sales performance and growth rate
Customer satisfaction and retention
Operational efficiency and delivery timelines
Workforce and turnover insights
Goal progress and overall performance score
Dashboard Purpose
Gives leaders a single, real-time view of business health, combining financial, operational, and people data into one executive dashboard.
Business Overview / CEO Dashboard
The showcased dashboards are example templates intended for demonstration purposes. Each final solution is specifically crafted and tailored for every client by Studio Data Flow.
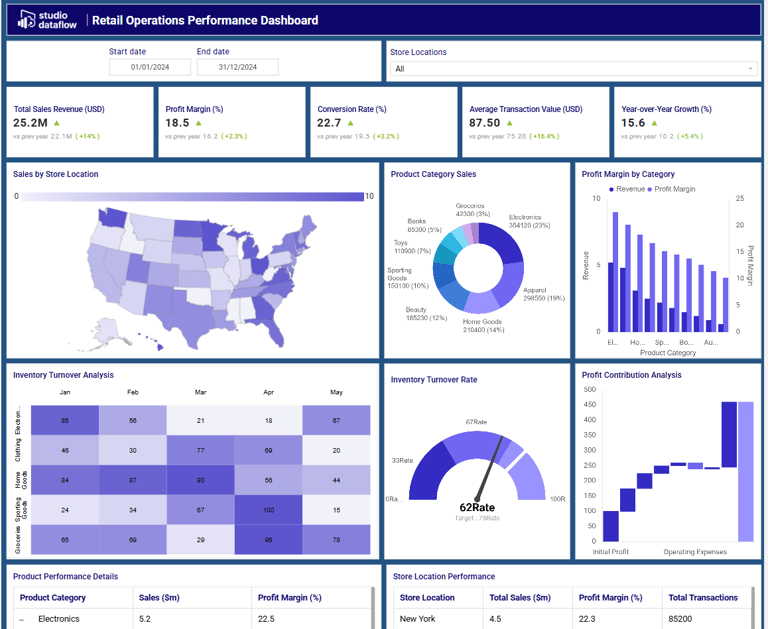
Store Sales Report
Audience
Retail managers, store owners, regional heads, and marketing teams who need visibility into store performance and product profitability.
Key Performance Metrics
Total sales and profit by store, region, and category
Product mix and top-selling items
Gross margin % and net profit by category
Sales growth trends (daily, weekly, monthly)
Average transaction value and basket size
Customer count and conversion rate
Inventory turnover and stock-out rate
Dashboard Purpose
Gives a complete view of store and product performance — helping retailers identify best-selling items, improve margins, and optimize inventory decisions.
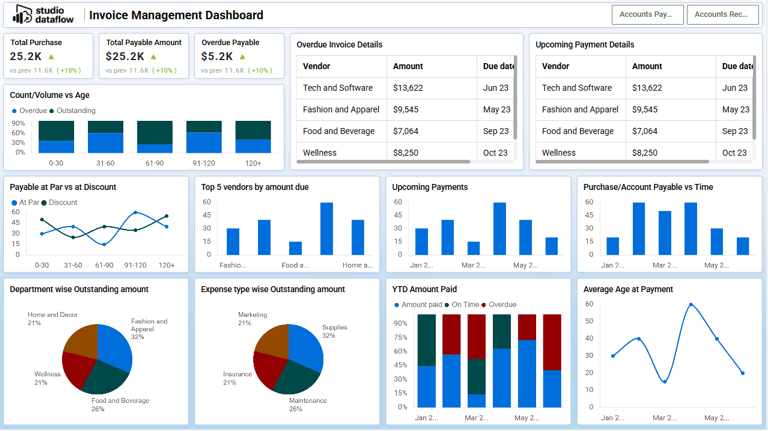
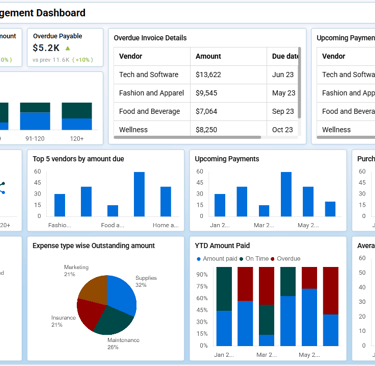
Finance & Accounting Dashboard
Audience
CFOs, finance managers, and executives who need visibility into revenue, expenses, and profitability.
Key Performance Metrics
Total revenue, expenses, and net profit
Gross and net profit margins (%)
Operating cost trends
Variance vs. budget and forecast
ROI by department or project
Month-over-month and YTD growth
Dashboard Purpose
To provide finance leaders a concise view of the organisation’s financial health, simplifying data into actionable insights for smarter decisions.
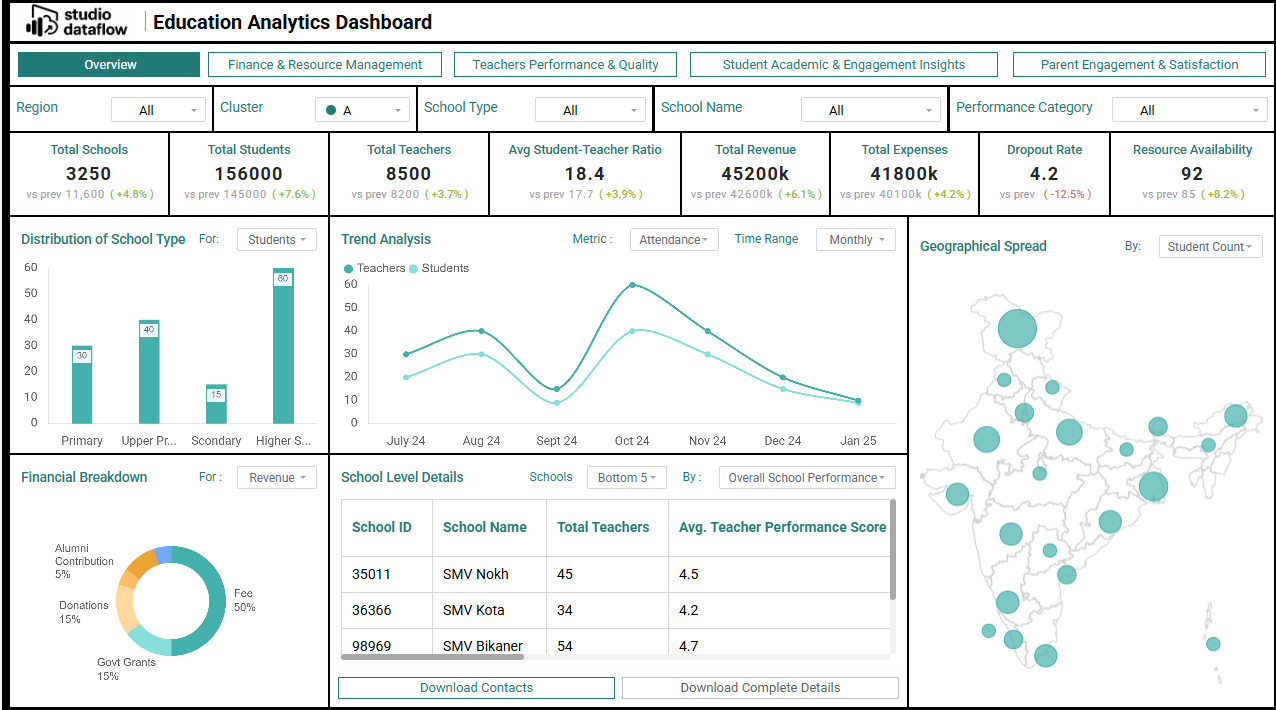
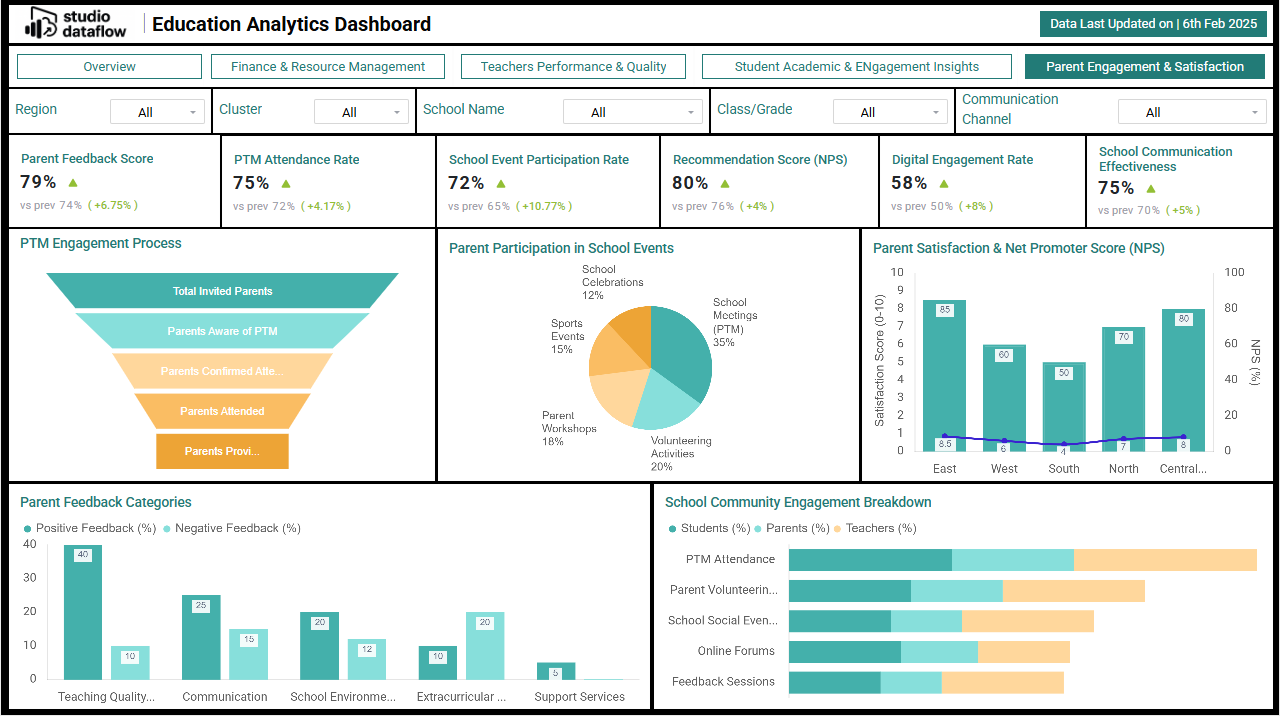
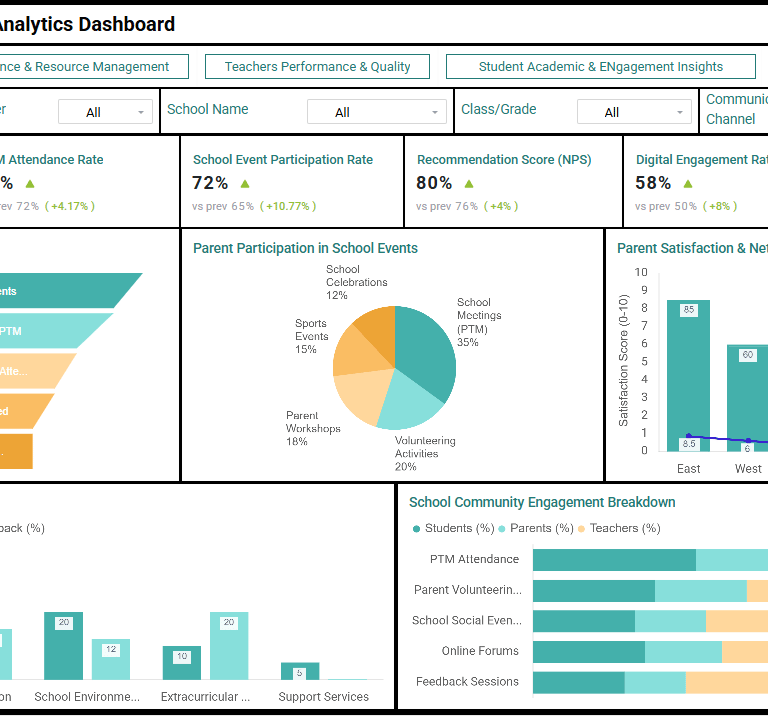
Audience
School administrators, principals, teachers, academic coordinators, and education department leaders tracking student and institutional performance.
Key Performance Metrics
Student performance by subject, class, or grade
Attendance rate and absentee trends
Course completion and pass rates
Enrolments and retention statistics
Teacher performance and workload metrics
Exam scores and GPA distribution
Student-to-teacher ratio
Graduation and dropout rates
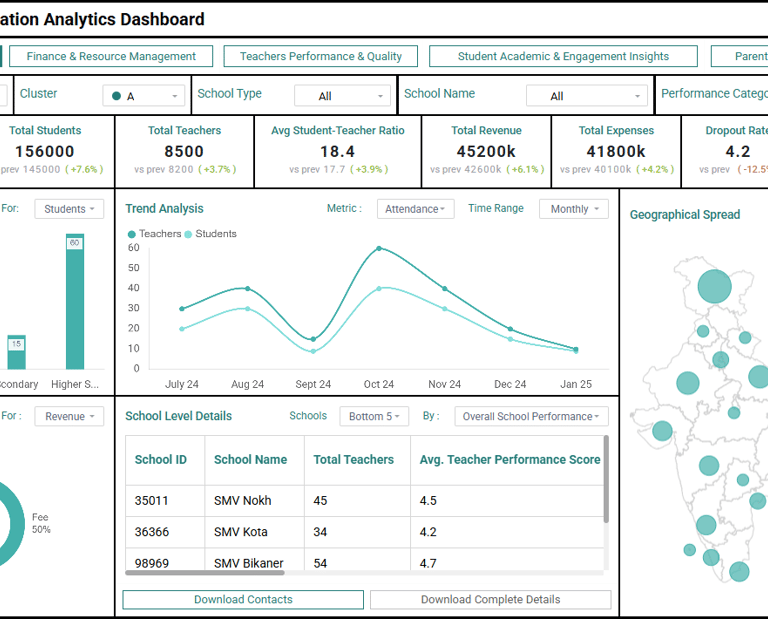
Dashboard Purpose
Provides a clear view of academic progress, engagement, and outcomes helping educators make data-driven decisions to enhance learning and performance.
Education Dashboard
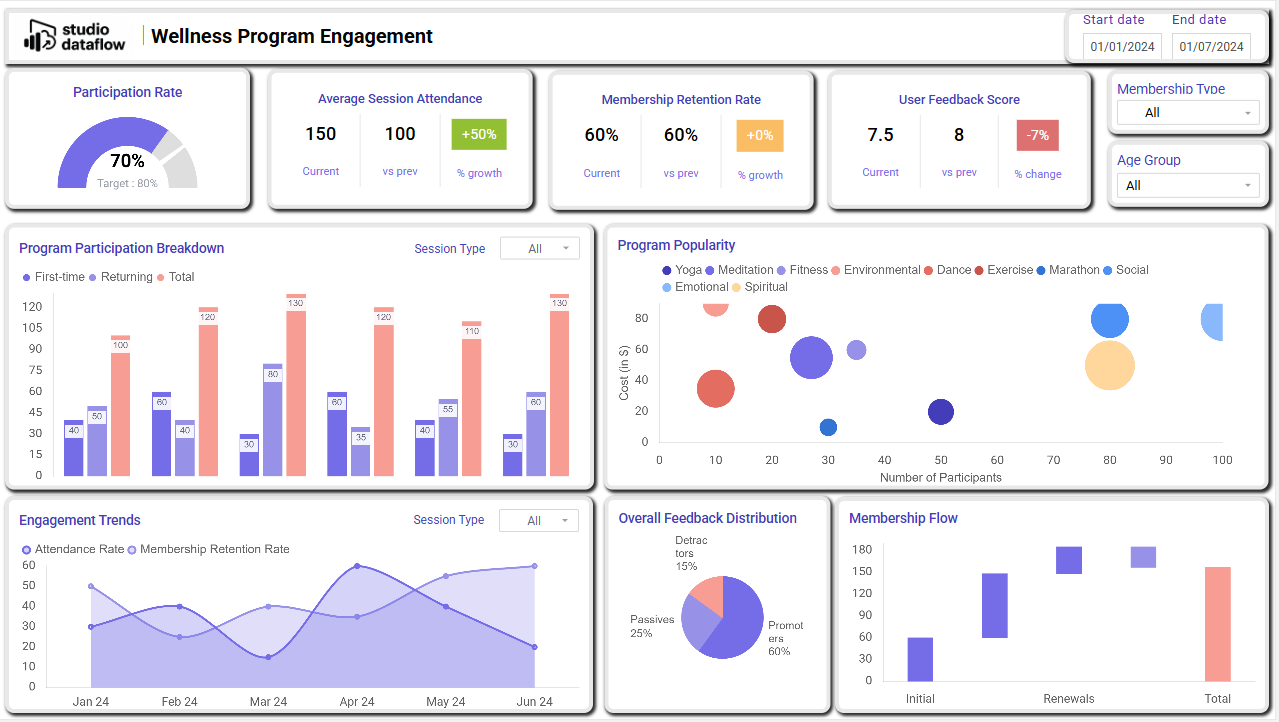
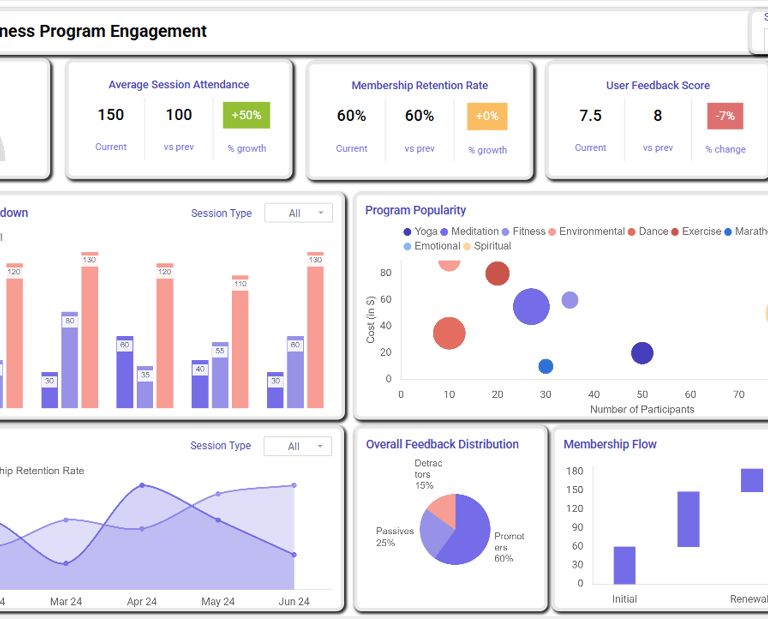
Audience
HR teams, wellness coordinators, and program managers.
Key Performance Metrics
Participation and attendance rates
Membership retention and renewals
User feedback and satisfaction score
Program popularity and engagement trends
Dashboard Purpose
Tracks employee engagement and satisfaction to improve wellness program impact and participation.
Wellness Dashboard
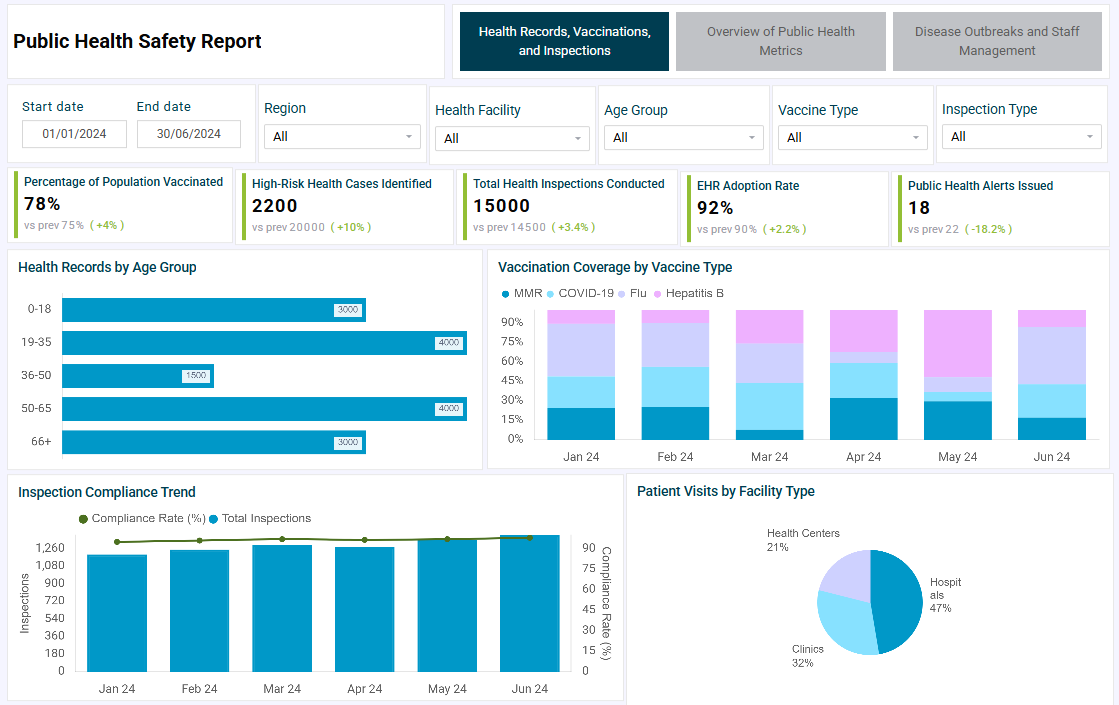
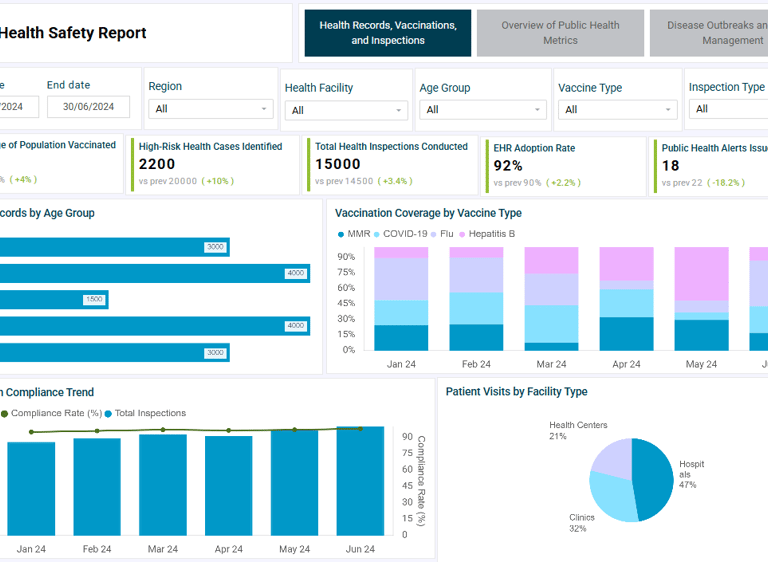
Audience
Health departments, hospitals, and government agencies.
Key Performance Metrics
Vaccination rate and coverage
Health inspections and compliance
Electronic Health Report (EHR) adoption and public alerts
Patient visits and high-risk cases
Dashboard Purpose
Monitors vaccination progress, health compliance, and safety trends to improve public health outcomes.
Public Health Dashboard
Follow US
Contact
+61-484645097
© 2025. All rights reserved.